The Linux Load Average - and what these numbers tell you
If you wanna talk about the load of a Linux system or if you wanna measure the load of a Linux system for monitoring purposes, you are always talking about a sequence of three decimal values:

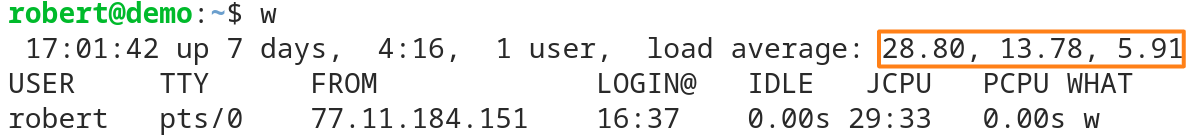
The screenshot above was taken from the command “w” on a reasonably busy Linux system and you see the three decimal numbers describing the load average of the system.
But what are these numbers telling you?
In contrast to Windows based systems, where you typically talk about the CPU utilization in percent, the three values of the load-average gives you a great insight into if your system is idle or loaded.
And with the addition of some detail of your system, it is really easy for you to judge the current load.
Is your system overloaded? And if yes, how much more resources are needed to serve the current requirements.
… or maybe your system isn’t overloaded at all, although the numbers seem so at a first glance.
A second useful information you’ll get from these numbers is if you are observing your system during a short lasting load peak only or if the load your system is dealing with is a constant one.
Let’s start with talking about the one who is calculating these three numbers for us: The process scheduler.
The process scheduler is responsible for calculating the load average
The main task the process scheduler is responsible for is to give the available CPU cycles to all the processes that want to do some work (aka they want to run).
And because this has to be done in a fair manner, all the processes that want to run need to enqueue into a queue: the process scheduling queue.
Every time the CPU has idle resources, the process scheduler takes the first process from the process queue to hand it over to the CPU.
Then this process can use the CPU for a little amount of time. And after that time is over, the process scheduler hands over the next process from the queue to the CPU.
(Although the model described here is somewhat simplified, it describes the load average in an understandable visualized way.)
Three sliding averages
Every time the CPU scheduler takes a process from the process queue, it counts the processes currently waiting in the queue and (re)calculates three sliding averages:
first: The average number of processes in the queue during the last minute (load1)
second: The average number of processes in the queue during the last five minutes (load5)
third: The average number of processes in the queue during the last fifteen minutes (load15)
And every time you ask the system for the load average, you will get these three numbers in a row:
load1, load5, load15
Let’s force a load average of 1.00 or above
Most of the processes on a system do not want to run all the time: They wait for the perfect time to run (e.g. a user-input or a network packet to arrive), then they do their work for some time, and after that they wait for the next perfect time to run.
You can see this behavior clearly if you call for instance “ps ax” on a system:
The output of this command shows you in the third column the current state of a process, where we wanna take a look here at the first flag only:
...
13773   ?   S 0:00 pickup -l -t unix -u -c
14324   ?   S 0:00 [kworker/u4:1]
15121   ?   Ss 0:00 sshd: [accepted]
15122   ?   S 0:00 sshd: [net]
15123 pts/0 R+ 0:00 ps ax
As you see - four processes of the excerpt shown here have the flag S - that means that they are “sleeping” - they are doing nothing currently.
Only the last process in this example - the process “ps ax” - shows an R for its stat. This flag is the marker for a “runnable” process.
These processes marked with an “R” are the processes that are either currently running or they’re waiting in the process-queue for getting their next amount of CPU time.
So if we could create a process that wants to run all the time without waiting occasionally, then we would always have this process waiting in the process queue:
Every time the process has got his fair amount of CPU time, he immediately enqueues into the process queue again, to get the very next slice of CPU cycles he can get hold of.
That means - the process scheduler would see from now on as a minimum this single process in the process queue. So that after some time all the three sliding averages would go up to or over the value of 1.
Start a process that wants to run all the time and forever
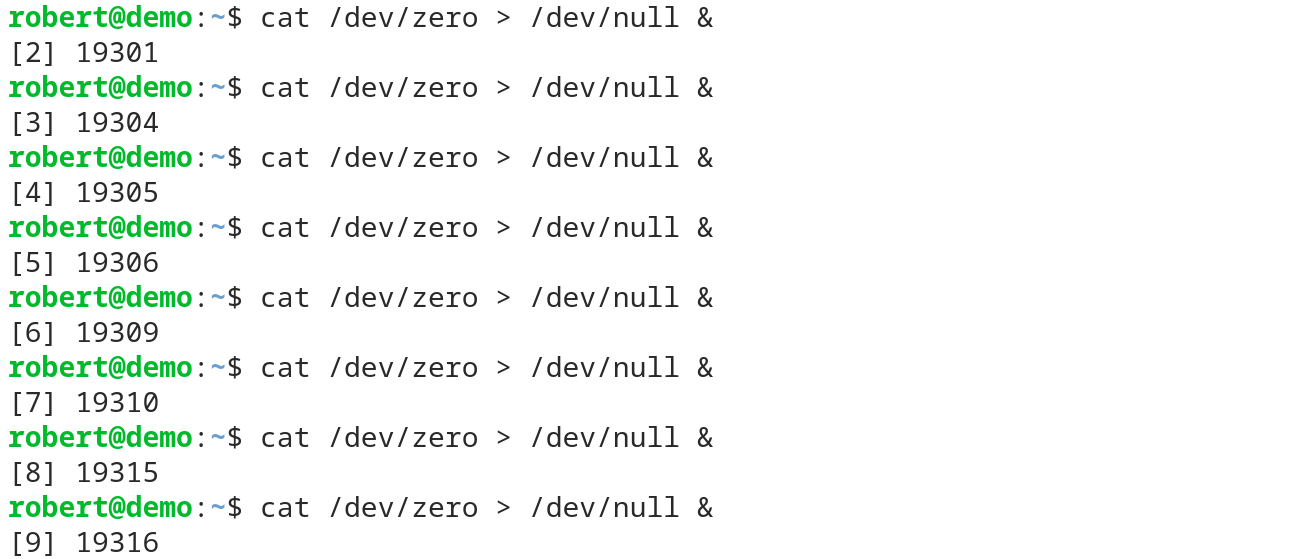
As a non-destructive example we could simply start the following command line to generate a continuously running process:

This example simply uses two special device files every Linux system gives you, combined with an output redirection:
At first, the command “cat” prints out all the content it can get from the file /dev/zero.
This special file generates one zero after another, as long as someone reads from the file.
So if “cat” prints out the file, it will never reach its end.
The output “cat” generates is then simply redirected to the second special file called “/dev/null”.
This file happily takes all the data you write into it … and forgets it immediately.
So no matter which amount of data you will write into this file, it never gets filled up.
In the example command line above, I added a “&” at the end of the command line, to get it started in the background. This serves here for the fact to have a fresh command line prompt available after starting the process without terminating the “cat” process or opening an additional terminal.
Now the load average will grow up to 1.00 or more
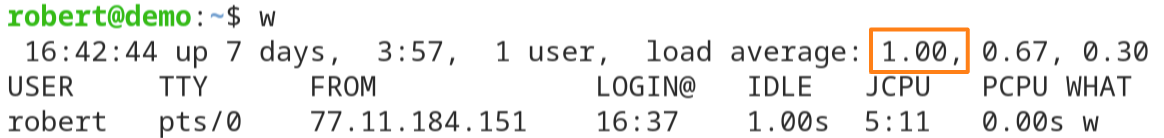
If we now monitor the developing load average of the system, we will recognize that the first value of the load average - load1 - will slowly climb up to 1.00:
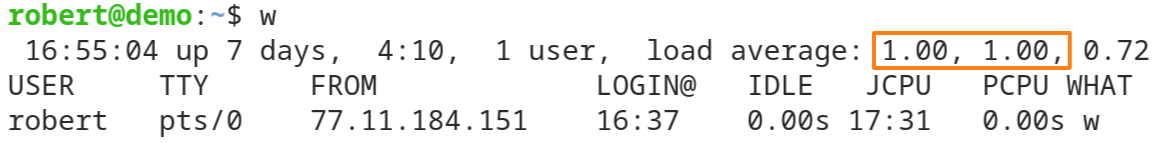
And if you are patient and wait a few minutes more, you will see the other values load5 and load15 reaching 1.00 too:
If the system where you are running the “cat” command line is somewhat busy with other tasks, then you will see values greater than 1.00:
A continuously running process will just add another 1.00 to the values you would see without it.
If you are on a busy server, then chances are high that the values you see without additional load added are way higher than 1.0 (see the first example screenshot of this article).
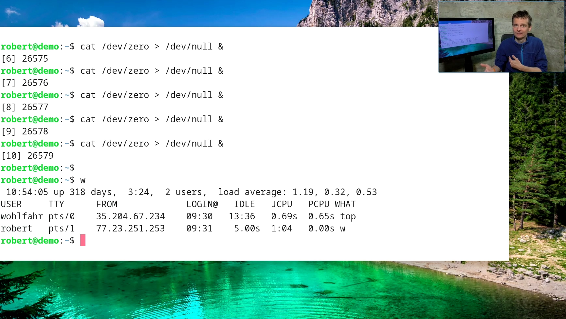
And on my demo system I can simply simulate this behavior by starting a few more of these “cat” command lines:
So now that nine of these very busy “cat” processes are running, the load on the system will slowly go up to 9.00 or above. First with load1, a few minutes later with load5 and at last with load15.
But also load values way above 20.00 or more could be seen in the wild. The following is a screenshot after running a few more of these command lines for a few minutes (I think I started 34 or so …)
But at the same time I can work at the command line as usual:
The process-scheduler does its best to distribute the available CPU resources fairly, so that my command line work, which usually doesn’t need a lot of CPU cycles, isn’t slowed down too much.
But if you see such numbers on a real system, you’re probably wondering if the system in this seen state is overloaded … or not?
But before talking about this, let’s terminate these unneeded load creators:
killall cat
Is the system overloaded or not?
Answering this question - if a system is overloaded or not - boils down to answering a slightly different one:
How much load can your system handle without slowing down?
If your system runs at full speed (all the built-in fans are venting at their highest pace) but no single one of your processes is slowed down, then your system is not overloaded at all.
Sure - it may be completely loaded without any spare resources available, but it is not overloaded.
Only if you give more work to the CPU than it can handle, then your system is overloaded and processes are slowed down.
Luckily the load average numbers on a Linux system give you - together with a little insight into the system-architecture - all the information you need to answer the question.
So - what is the load a system can handle without slowing down the processes?
What’s the load a Linux system can handle?
If we think about this a little bit, then it comes down to the number of CPU cores your system has available.
Why? Just because …
… a single CPU core is only able to run one single process at any point of time.
But what if we need CPU resources for a second process, but we only have this single CPU core available?
Well - then the two processes need to share this single CPU
They just get a few CPU cycles each in turn:
First the process #1 can run for a few milliseconds.
Then it has to stop and process #2 can use the now available CPU.
In the meanwhile, the process #1 simply enqueues into the process queue and waits there until it’s its turn again.
And because the processes are running alternating - they need twice the time they would need if running alone.
So let’s summarize this for a system with one single available CPU core
The big picture with a single available CPU
Situation #1: One single continuously running process
- the CPU is busy all the time, no spare resources are available
- the load reaches 1.00 after a few minutes
- if no other process wants to run, then the process runs as fast as possible –> the system is not overloaded
»The system is loaded for 100%, but it is not overloaded.«
Situation #2: Two continuously running processes
- the CPU is still busy all the time, no spare resources are available
- the load reaches 2.00 after a few minutes
- if no other process wants to run, then the two processes run half as fast as if they were running alone
»The system is overloaded«
I think you’ve got it: If you are on a single CPU system (which means a single CPU core), then a load of 1.00 or above shows you that the system doesn’t have any idle resources left. The system is fully loaded.
If the load gets higher than this 1.00, processes are slowed down. And that means your system is overloaded.
Let’s think through the same situations, but this time with multiple available CPU cores
The big picture with a two-CPU system
Situation #1: One CPU and one single continuously running process
- one of the two the CPU is busy all the time, but the second CPU has resources available
- the load again reaches 1.00 after a few minutes
- the process runs as fast as possible –> the system is not overloaded and has 50% spare resources (the second CPU)
»The system is 50% loaded«
To illustrate this, see the following screenshot. It was taken on a dual CPU system, fter one single “cat” process was running for a few minutes and it shows the output of the command “top”:
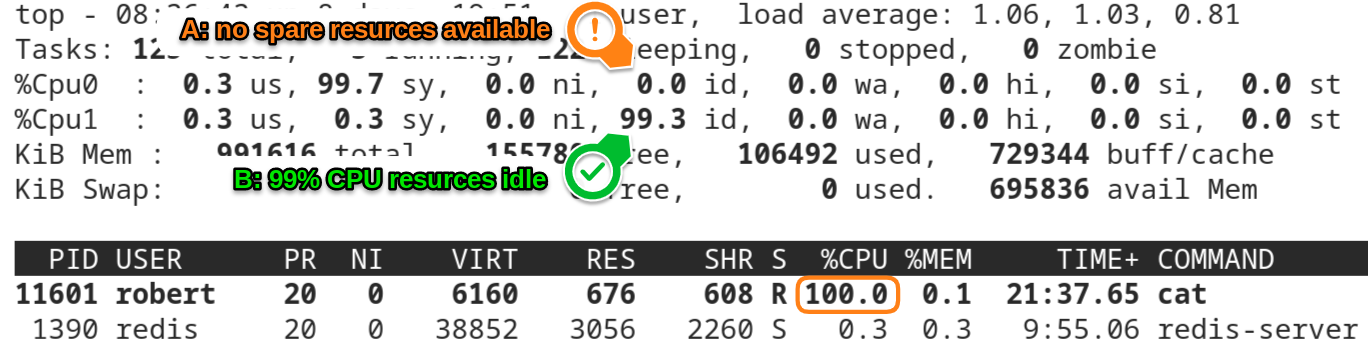
On this screenshot you see three important facts:
first: The load of the system
The values of load1 and load5 are slightly above 1.00. So we know that there was on average one process in the process-queue during the last 1 and 5 minutes.
second: There is one busy “cat” process that uses a complete CPU core
Do you see the line that shows the cat-process with the process-id 11601?
I have marked the 100.0 in the column %CPU.
This value shows that the cat process uses 100% of a CPU core. And because one single process or thread can only run on one single CPU at any given time, the process runs as fast as it can on this system.
third: One of the two available CPUs is idle
If you hit the key “[1]” while running the “top” command, the single line that normally shows the average CPU statistics expands to one single line for every available CPU core on the system.
(here is the screenshot from above again)
In the screenshot you can see that the CPU labeled “Cpu0” has no idle resources available, while “Cpu1” has 99% of them.
So we know that - at the time the screenshot was taken - the “cat” process was running on Cpu0, while Cpu1 was mostly available for the same amount of the load Cpu0 handled at this time:
»The system was 50% loaded«
Situation #2: Two CPUs and two continuously running processes
- now both CPUs are busy all the time, there are no more spare resources available
- the load reaches 2.00 after a few minutes
- if no other process wants to run, then the two processes can run as fast as possible
See the screenshot below for an illustration:
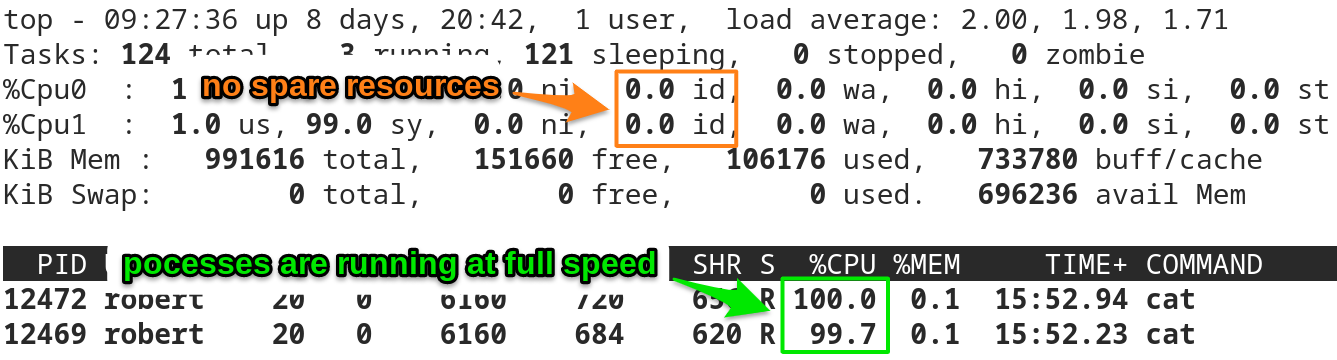
The load values load1 and load2 have reached a value around 2.00.
Neither of the two CPUs has any resources left:
»The system is completely loaded«
But both cat processes are running with nearly 100% of a CPU core. They are not slowed down:
»The system is not overloaded«
So I think you’ve got it as a whole:
To determine if a system is overloaded or not, you have to take the current load average and compare it to the CPU cores you have available on the system.
Compare the load with the number of CPUs available
To get the information, how many processes can run in parallel on a Linux system, take the number of available CPU cores.
To get this number, have a look into the special file “/proc/cpuinfo”
cat /proc/cpuinfo
and count the processors listed there.
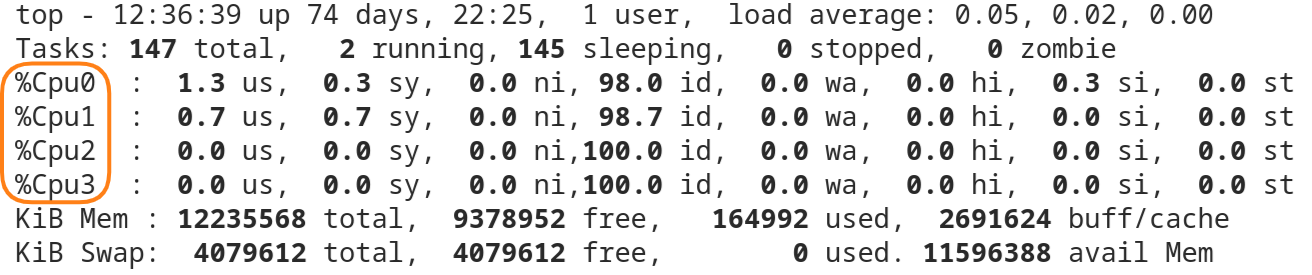
Or - and this is the way I do it typically - call the command “top” and hit the “[1]” key while it is running.
The lines containing the CPU statistics show you quickly the number of available CPUs.
The following example was taken from a system running with four CPU cores:
The Rule
The load your Linux system can handle without slowing down equals to the number of CPU cores available.
With this in mind: Try to avoid a “long lasting load average” (the load15 value) of greater than the CPU cores available.
Short load-spikes are ok and they are very common and typical on production systems.
But if you see the load15 going over the number of CPU cores you have, then you know that your processes are most of the time slowed down. And therefore you can see the system as overloaded.
Then you need to think about either
- a) adding more resources or
- b) reducing the overall load.
A few words about hyperthreading
If your system has hyperthreading enabled, then the number of logical CPU cores is twice the number of physical CPU cores on a system.
And these now doubled CPUs are shown just like “normal” CPUs on the Linux system. So instead of only four CPU cores, you would suddenly see eight logical CPUs.
The problem with this is, that simply enabling hyperthreading doesn’t suddenly double the CPU performance that is available.
As a rule of thumb, you can safely assume that enabling hyperthreading will typically add around 20-30% of CPU performance - just by optimizing the instruction-flow through the CPU cores.
Here is what to do next

If you followed me through this article, you certainly have realized that knowing some internals about how things are working at the Linux command line, can save you a lot of time and frustration.
And sometimes it’s just fun to leverage these powerful mechanics.
If you wanna know more about such “internal mechanisms” of the Linux command line - written especially for Linux beginners
have a look at “The Linux Confidence Framework”
In this framework I guide you through 5 simple steps to feel comfortable at the Linux command line.
This framework comes as a free pdf and you can get it here.
Wanna take an unfair advantage?

If it comes to working on the Linux command line - at the end of the day it is always about knowing the right tool for the right task.
And it is about knowing the tools that are most certainly available on the Linux system you are currently on.
To give you all the tools for your day-to-day work at the Linux command line, I have created “The ShellToolbox”.
This book gives you everything
- from the very basic commands, through
- everything you need for working with files and filesystems,
- managing processes,
- managing users and permissions, through
- software management,
- hardware analyses and
- simple shell-scripting to the tools you need for
- doing simple “networking stuff”.
Everything in one single, easy to read book. With explanations and example calls for illustration.
If you are interested, go to shelltoolbox.com and have a look (as long as it is available).